Summary
My article presents a practical framework, metrics, and a 90-day plan for designing, instrumenting, and governing feedback loops, illustrated with examples from lending and property insurance. By benchmarking every component of the business and focusing on feedback loops, the process will yield significantly improved results.
1) Foundations: What Feedback Loops Are and Why They Matter
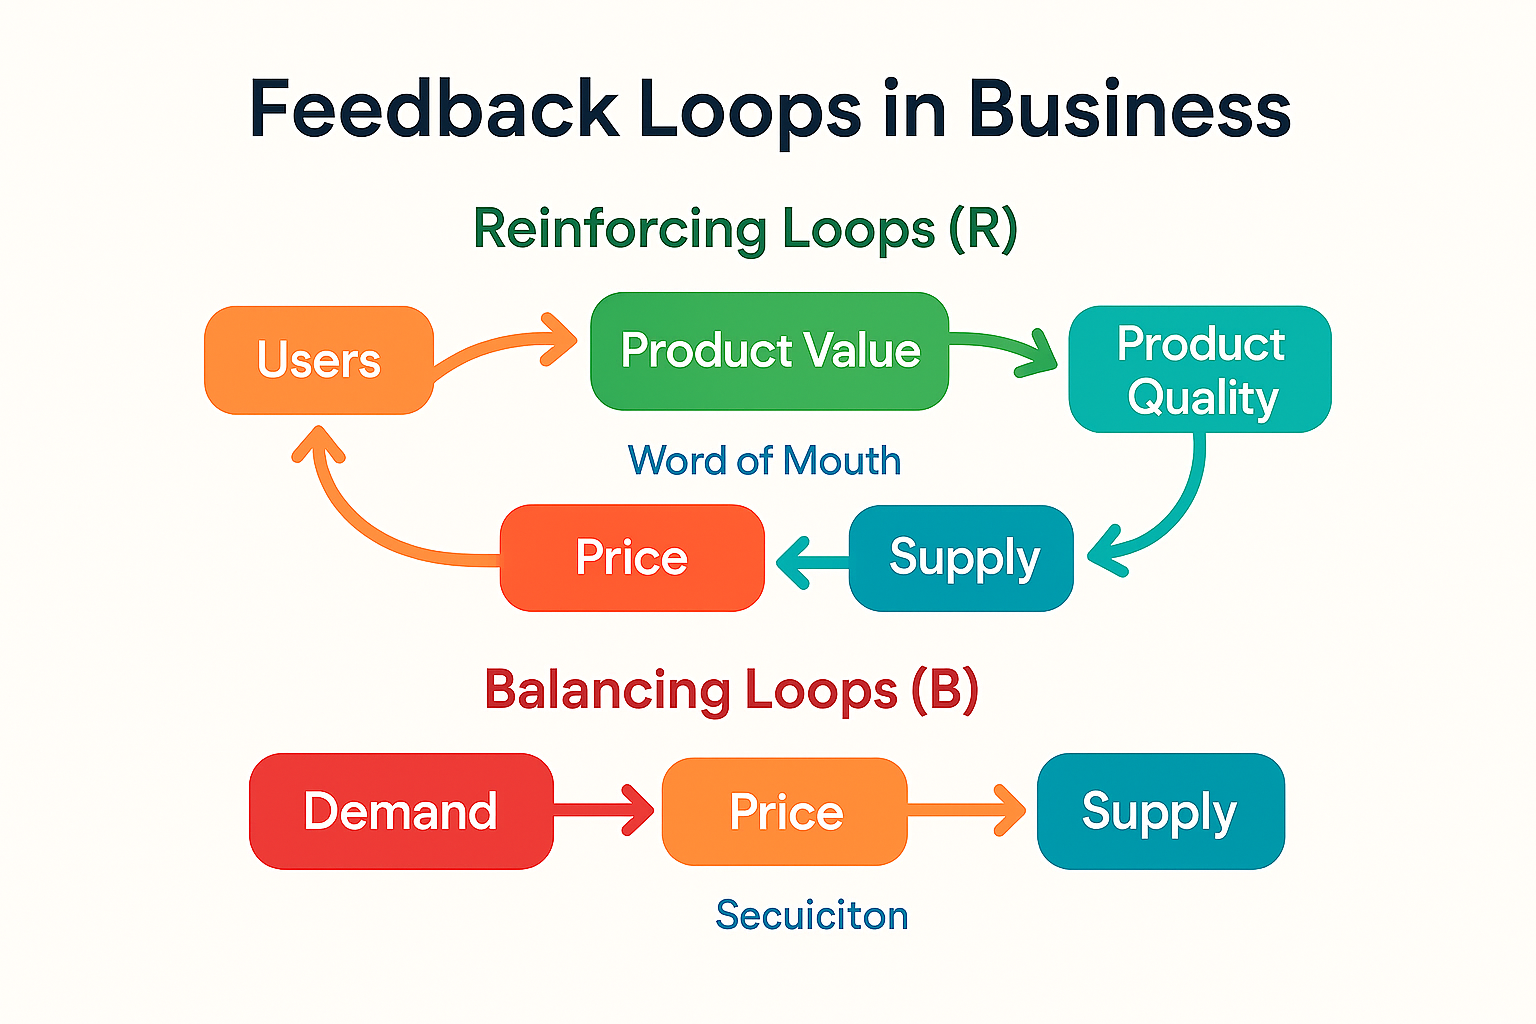
A feedback loop exists when a system’s outputs are routed back as inputs, influencing subsequent behavior.
- Reinforcing (R) loops amplify change and can drive compounding growth—or accelerating collapse.
- Balancing (B) loops counteract change and stabilize performance around a target.
Most business systems contain both, typically with nonlinear effects and delays that make outcomes unintuitive.
2) Reinforcing Loops: Building Durable Flywheels
Standard reinforcing loops and where to apply them:
- R1 – Product–Satisfaction–Demand
Product quality → Customer satisfaction/NPS → Demand/Revenue → Investment in product → Product quality. - R2 – Network & Reputation Effects
More customers → More reviews/testimonials/data → Higher perceived value → Higher conversion → More customers. - R3 – Talent–Innovation Flywheel
Talent density → Innovation rate → Differentiation → Win rate → Talent attraction → Talent density. - R4 – Operating Excellence → Brand
On‑time delivery/claims resolution/underwriting accuracy → Trusted brand → Lower CAC → Higher volume → Scale efficiencies → On‑time delivery/accuracy.
Key metrics: NPS/CSAT, conversion rate, referral rate, CAC, LTV: CAC, gross margin, cycle time, on-time delivery/close rate.
Unintended consequences: Overexpansion (quality slippage, service backlog), selection bias (attracting the wrong segments), and fraud/operational risk when growth stresses controls. In finance, rapid originations can mask deteriorating credit quality until delinquency lags reveal losses.
3) Balancing Loops: Guardrails that Prevent Runaway Risks
Typical balancing loops and how to tune them:
- B1 – Capacity & Quality Constraint
Demand ↑ → Utilization ↑ → Cycle time/defects ↑ → Satisfaction ↓ → Demand ↓.
Countermeasures: Buffers, WIP limits, cross-training. - B2 – Price Elasticity
Demand ↑ → Price ↑ → Demand moderates.
Guardrails: Discount thresholds to protect unit economics during spikes. - B3 – Risk & Compliance Controls
Loss events ↑ → Controls/underwriting stringency ↑ → Loss events ↓.
Caution: Over-control slows innovation and growth. - B4 – Cash Burn & Runway
Burn ↑ → Runway ↓ → Hiring/Capex/Marketing ↓ → Burn ↓.
Tactics: Stage hiring; tie spend to leading indicators. - B5 – Supply Chain / Pipeline Oscillations
Forecast error → Over-ordering/over-staffing → Inventory/backlog swings → Corrections → New forecast error.
Fixes: Shorten feedback, reduce batch sizes, smooth flow.
Unintended consequences: Cost-cutting can erode quality and increase churn; tightening credit can trigger adverse selection; excessive controls can reduce speed-to-market and talent engagement. The art is calibrating the strength and delay of these loops, not just adding more controls.
4) Time Delays and Nonlinearities: Why Good Intentions Oscillate
Delays between action and feedback (e.g., claims emergence, churn realization, credit losses) cause decision-makers to over- or under-correct. Queueing and capacity utilization are nonlinear. As utilization approaches 100%, cycle times rise sharply, creating service failures. In pipelines (mortgage, underwriting, and claims), batched work and long approval times amplify the bullwhip effect.
5) Instrumentation and Governance
· Define leading & lagging indicators
Leading: quote‑to‑close time, first response time, early‑stage delinquencies, and near-miss incidents.
Lagging: churn, charge-offs, combined ratio, net loss.
· Set guardrails & thresholds
Minimum gross margin, max CAC payback, credit box boundaries, capacity caps, pricing/discount approval rules.
· Decision rights & cadences
Weekly operating reviews for flywheel metrics; monthly risk committees for loss/incident trends; quarterly strategy reviews for loop redesign.
· Shorten feedback cycles
Automate telemetry, shift from batch to flow, A/B test policies, and create post-incident learning loops that actually change standards.
6) 90-Day Implementation Roadmap
Days 0–30: Map and instrument
- Map the top 3 reinforcing and three balancing loops end-to-end with owners. Add delay markers (τ) where data lags.
- Define 8–12 KPIs that reflect these loops, assigning a target, an owner, and an alert threshold to each.
- Stand up a simple weekly operating review that tracks loop health.
Days 31–60: Stabilize and de-risk
- Add capacity buffers or WIP limits when utilization exceeds 80%.
- Tighten the credit box where early loss signals emerge, paired with countermeasures to avoid adverse selection.
- Introduce pricing guardrails and discount approval thresholds.
Days 61–90: Accelerate flywheels
- Launch one cross-sell/upsell loop (referral rewards, renewal incentives).
- Invest in quality improvements that raise NPS and reduce rework.
- Codify lessons into playbooks and adjust decision rights so the organization can self-correct more quickly.
7) Sector Vignettes (Lending and Property Insurance)
Mortgage & Real‑Estate Lending — Flywheels and Guardrails
- Reinforcing: Lead quality → Underwriting speed/accuracy → Approval rate → Funded loans → Referral rate → Lead quality. Add productized Borrower education to boost conversion and reduce fall‑out.
- Balancing: Delinquencies/Early Payment Default → Tighter credit box → Approval rate ↓ → Volume ↓. Cash burn/runway loop during rate shocks. Capacity constraints in appraisal/escrow → Cycle time ↑ → Fall‑out ↑.
- Unintended consequences: Emphasis on speed can raise repurchase risk and fraud exposure; tightening too far invites adverse selection; rising insurance premiums/HOA dues break DTI and kill approvals, feeding a negative volume loop.
Property Insurance (California) Stability vs. Access
- Reinforcing: Operational excellence → Faster, fair claims → Higher trust/retention → Scale → Better reinsurance terms → Pricing power → Continued excellence.
- Balancing: Catastrophe frequency/severity ↑ → Loss ratio ↑ → Capital/reinsurance constraints → Underwriting restrictions or rate filings → Written premium ↓.
- Unintended consequences: If rate approvals lag behind loss trends, carriers may retrench or exit, reducing competition and availability. Consumers may shift to FAIR Plans or surplus lines, increasing underinsurance risk and amplifying losses when events occur.
8) Practical Checklist
- Please list your top 5 loops (R and B), draw them, and name an accountable owner for each.
- For each loop, identify one leading indicator, one lagging indicator, and a threshold that triggers action.
- Mark all material delays (τ) and shorten at least one within 60 days.
- Install capacity buffers where utilization >80% and your promise is time-bound.
- Create a single “risk lens” metric per product (e.g., early‑stage delinquency rate, near‑miss frequency, complaint severity).
- Implement one incentive that strengthens a flywheel (e.g., referrals, reviews, renewals) and one control that mitigates risk (e.g., credit limits, authority levels).
- Run one scenario drill per quarter: +30% demand, −30% demand, +200 bps rates, insurance premium shock.
Conclusion
Winning companies don’t stumble into momentum—they design it. By explicitly mapping reinforcing flywheels, calibrating balancing guardrails, and tightening feedback delays, leaders can compound value while avoiding the typical pitfalls of overexpansion, adverse selection, and control drag. The result is a business that accelerates when it should, stabilizes when it must, and learns faster than its environment changes.