Summary
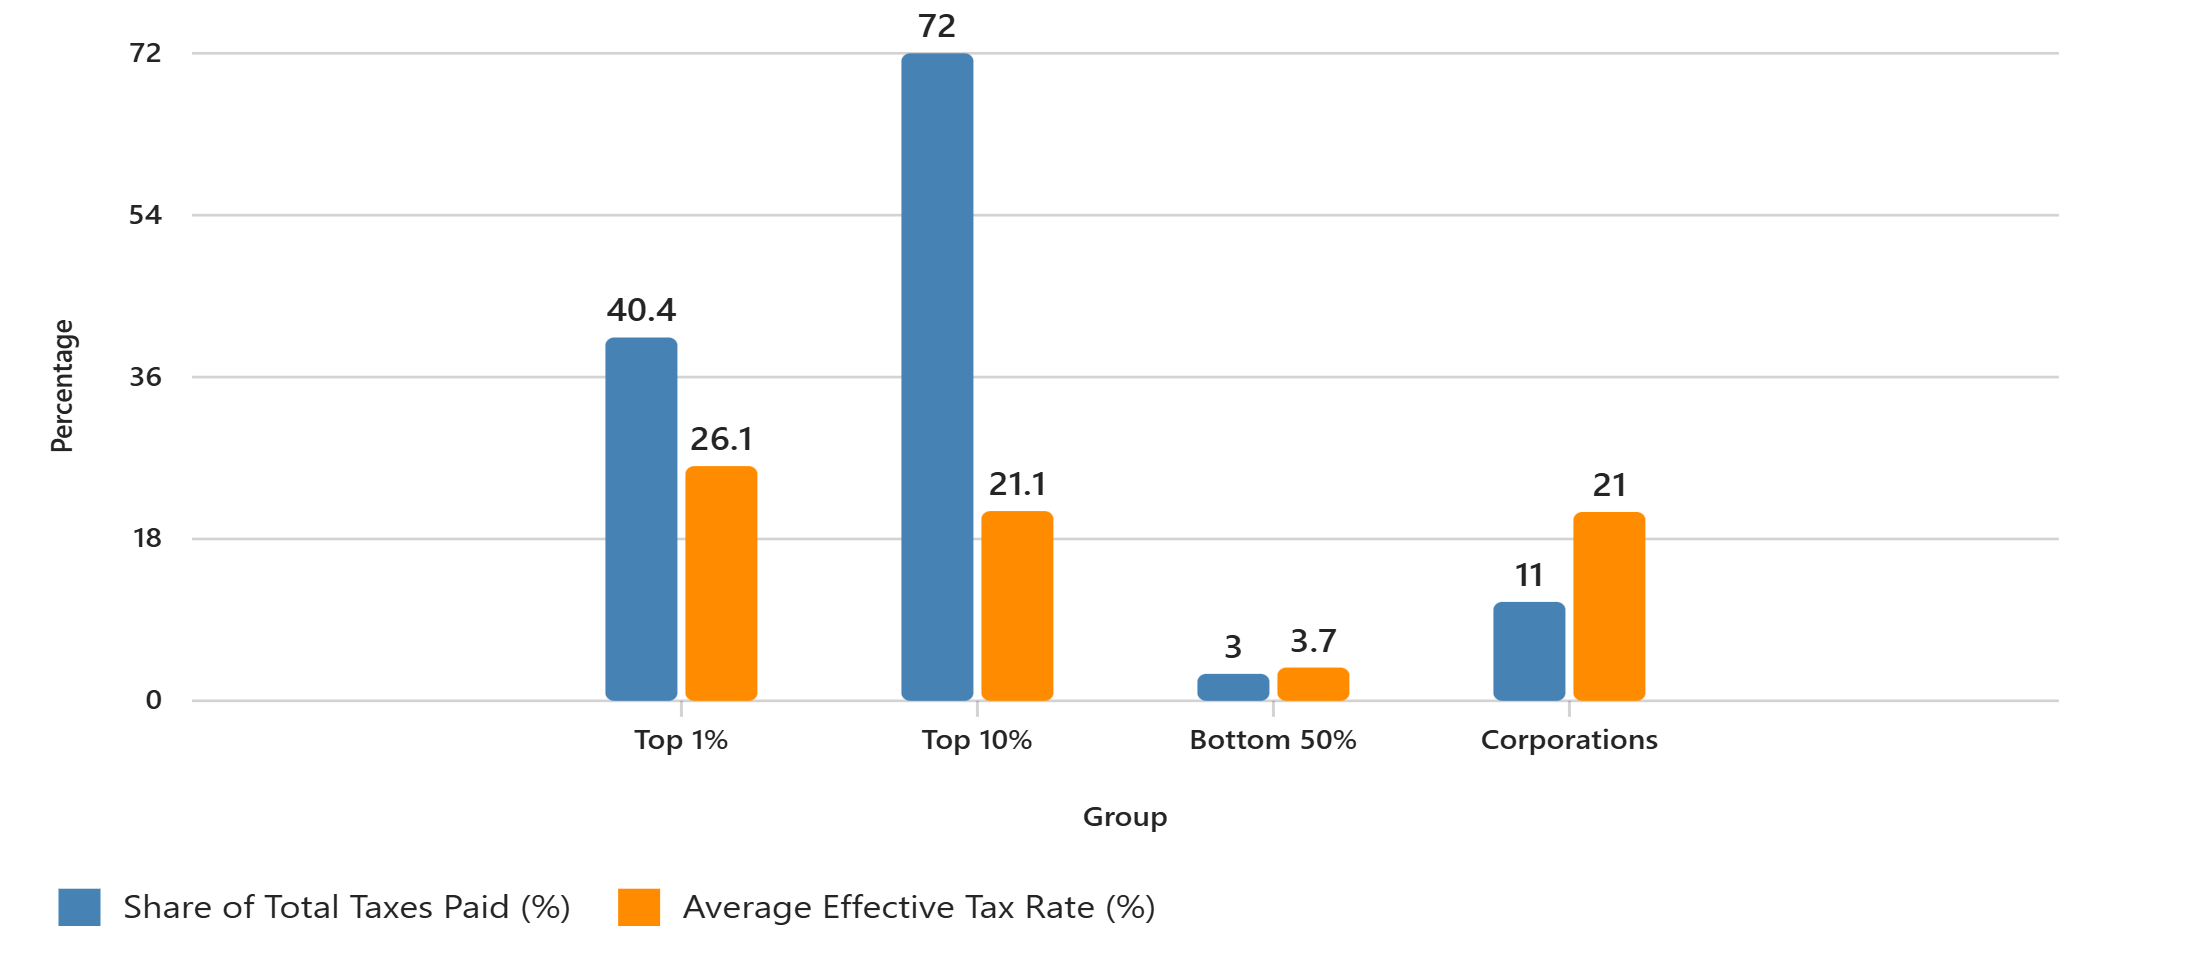
Federal Tax Contributions by Economic Group (2022 Data) This chart compares the share of total federal income taxes paid and the average effective tax rate across four key groups: the top 1% of earners, the top 10%, the bottom 50%, and corporations. While the top 1% contribute over 40% of total income taxes, the bottom half of earners pay just 3% of the total. Corporations, despite generating substantial profits, contribute only 11% of total federal revenue, highlighting stark disparities in the distribution of tax burdens.
Summary:
When someone tells you that the workers who earn and pay taxes do not pay their fair share, show them this article.
- Working Americans (primarily middle- and lower-income) contribute significantly through payroll and income taxes.
- High-income earners pay a large share of federal income taxes but often benefit from tax code advantages.
- Corporations contribute less proportionally and benefit from deductions that reduce taxable income.
- The system is progressive in structure, but inequities in effective tax rates and loopholes allow some to pay far less than others with similar incomes.
Article:
I make assertions in this article that require considerable sensitivity. There is a clear distinction between the working middle class, the working lower middle class, the working poor, and those who choose not to work, despite being able-bodied.
The first three subsets above are under severe financial stress due to our rigged economic system, which prioritizes the top tier. The majority of the lower middle class and the working poor have no discretionary income to pay anything other than subsistence, and sometimes not even that. Those who choose not to work are reaping the benefits of the welfare state and acting as a drag on the economic engine.
The way our economic enterprise is structured, elites generate wealth through leverage and debt. The more assets they purchase on leverage, the wealthier they become because of inflation.
This scheme has been in place since the creation of the Federal Reserve System in 1913. All the other classes must earn wages, pay taxes, cover living expenses, and contend with the storm of inflation. They are clearly on an economic treadmill, where they may seek a pay increase, but inflation erodes the benefit. Correspondingly, the dollar’s value erodes, and everything costs more due to diminished purchasing power. They can’t break out of the system, nor can they keep up with it.
Here’s a way to dissect this complex topic with depth and nuance:
1. Who “Works for a Living”?
This typically refers to people who earn income through labor, services, or entrepreneurship.
Examples include:
- Wage earners: Employees in sectors like construction, healthcare, education, retail, manufacturing, etc.
- Small business owners: People running local shops, service businesses, or independent consultants.
- Gig workers and freelancers: Drivers, delivery workers, writers, designers, etc.
- Farmers and tradespeople: Those producing food, building infrastructure, or maintaining essential systems.
These individuals contribute directly to the economy by producing goods or services and paying taxes.
2. Who “Takes and Produces Nothing”?
This phrase often refers to individuals or entities perceived as benefiting from public or private resources without making a proportionate contribution to their use. Examples sometimes cited include non-disabled
- Individuals who rely long-term on welfare without seeking employment (though this is a small and often misunderstood group).
- Corporate entities receive subsidies or bailouts while outsourcing jobs or avoiding taxes.
- Speculators or rent seekers who profit from asset inflation (e.g., real estate or financial markets) without producing tangible goods or services.
- Bureaucratic inefficiencies in government or large institutions that consume resources without delivering value.
However, it’s crucial to approach this with a nuanced understanding. Many people who receive public assistance are working, disabled, elderly, or temporarily unemployed, a nd some forms of “non-production” (such as investing or managing assets) can still contribute to economic growth, shedding light on the diverse ways in which individuals and entities contribute to the economy.
Here’s a comprehensive comparison of tax contributions in America by different groups—working individuals, wealthy households, and corporations—based on the latest available data:
3. Federal Income Tax Contributions by Income Group (2022 IRS Data)
Income Group |
Share of Total AGI |
Share of Federal Income Taxes Paid |
Average Tax Rate |
Top 1% (AGI > $663K) |
22.4% |
40.4% |
26.1% |
Top 10% (AGI > $178K) |
49.4% |
72.0% |
21.1% |
Bottom 50% (AGI < $50K) |
11.5% |
3.0% |
3.7% |
-
The top 1% paid more in federal income taxes than the bottom 90% combined.
-
The bottom half of taxpayers paid a relatively small share of total income taxes, primarily due to refundable credits such as the Earned Income Tax Credit (EITC).
4 Total Federal Revenue Sources (2024 Budget)
|
Source |
Share of Federal Revenue |
|
Individual Income Taxes |
49% |
|
Payroll Taxes (Social Security & Medicare) |
35% |
|
Corporate Income Taxes |
11% |
|
Other (Excise, Estate, Customs, etc.) |
5% |
- Working Americans contribute significantly through payroll taxes, which are regressive and capped at $182,400 in earnings.
- Corporations contribute a relatively small portion despite large profits, due to deductions and loopholes.
5. Tax Burden by Wealth Group
- Ultra-wealthy individuals often pay lower effective tax rates due to:
- Preferential treatment of capital gains and business income.
- Extensive use of deductions and credits.
- Ownership of corporations that pay taxes separately.
- Corporate taxes paid by businesses owned by the wealthiest are often the most significant component of their total tax burden, but still lower than what wage earners pay proportionally.
6. Effective vs. Statutory Tax Rates
- Among the top 1%, effective tax rates, which represent the actual percentage of income paid in taxes after all deductions and credits, range from 3% to 45%, depending on the type of income and deductions.
- Middle-income families typically pay between 5% and 113%of their income
- Eliminating tax preferences, such as preferential capital gains rates or mortgage interest deductions, could raise $560 billion in revenue and reduce disparities.
7. Corporations vs. Individuals
- Individuals pay the vast majority of income taxes.
- Corporations are taxed only on their profits after deducting expenses, while individuals are taxed on their gross income.
- This creates a structural imbalance in which workers bear a disproportionately greater share of the tax burden compared to businesses.
Here’s a visual comparison of federal tax contributions by major economic groups in the U.S.:
8. Chart Highlights
-
Top 1%: Pay over 40% of total federal income taxes, with an average effective tax rate of 26.1%.
-
Top 10%: Contribute 72% of total income taxes, with a slightly lower average rate of 21.1%.
-
Bottom 50%: Pay only 3% of total income taxes, with an average rate of 3.7%.
-
Corporations: Contribute about 11% of total federal revenue, with an estimated effective tax rate of 21%.