1. Scale and Reach
Teachers’ unions, primarily the National Education Association (NEA) and American Federation of Teachers (AFT), represent millions of educators and wield significant bargaining power at the state and local levels.
Their influence extends to:
- Collective bargaining agreements on pay, benefits, and working conditions.
- Political lobbying for legislation on funding, tenure, certification, and class size.
- Campaign contributions to candidates and ballot initiatives aligned with union priorities.
2. Policy Leverage
Unions often advocate for:
- Increased funding and higher teacher compensation.
- Limits on school choice (charters, vouchers) to preserve traditional district structures.
- Regulatory frameworks that maintain tenure protections and restrict performance-based pay.
This can conflict with decentralization goals, as unions typically favor uniform standards and federal programs that guarantee funding streams and labor protections.
Understanding how unions influence education policy and reform is essential for the audience to grasp their role in shaping meaningful change and policy outcomes.
Research and case studies suggest:
- Resistance to accountability reforms: Unions frequently oppose high-stakes testing and merit-based evaluations, arguing they narrow curriculum and penalize teachers for systemic issues.
- Mixed effects on student outcomes: Some studies link a strong union presence to higher teacher pay and greater job stability, whereas others associate it with slower adoption of innovative models (e.g., tutoring programs, extended learning time).
4. Federal Nexus
Federal programs (Title I, IDEA) often come with labor-related compliance requirements, which unions help shape through lobbying. This creates a feedback loop: federal dollars → federal rules → union bargaining leverage.
5. State-Level Dynamics
Understanding how legal and economic factors shape union presence and power can help the audience appreciate the complexity of union influence and identify areas for potential engagement or policy change.
Bottom Line
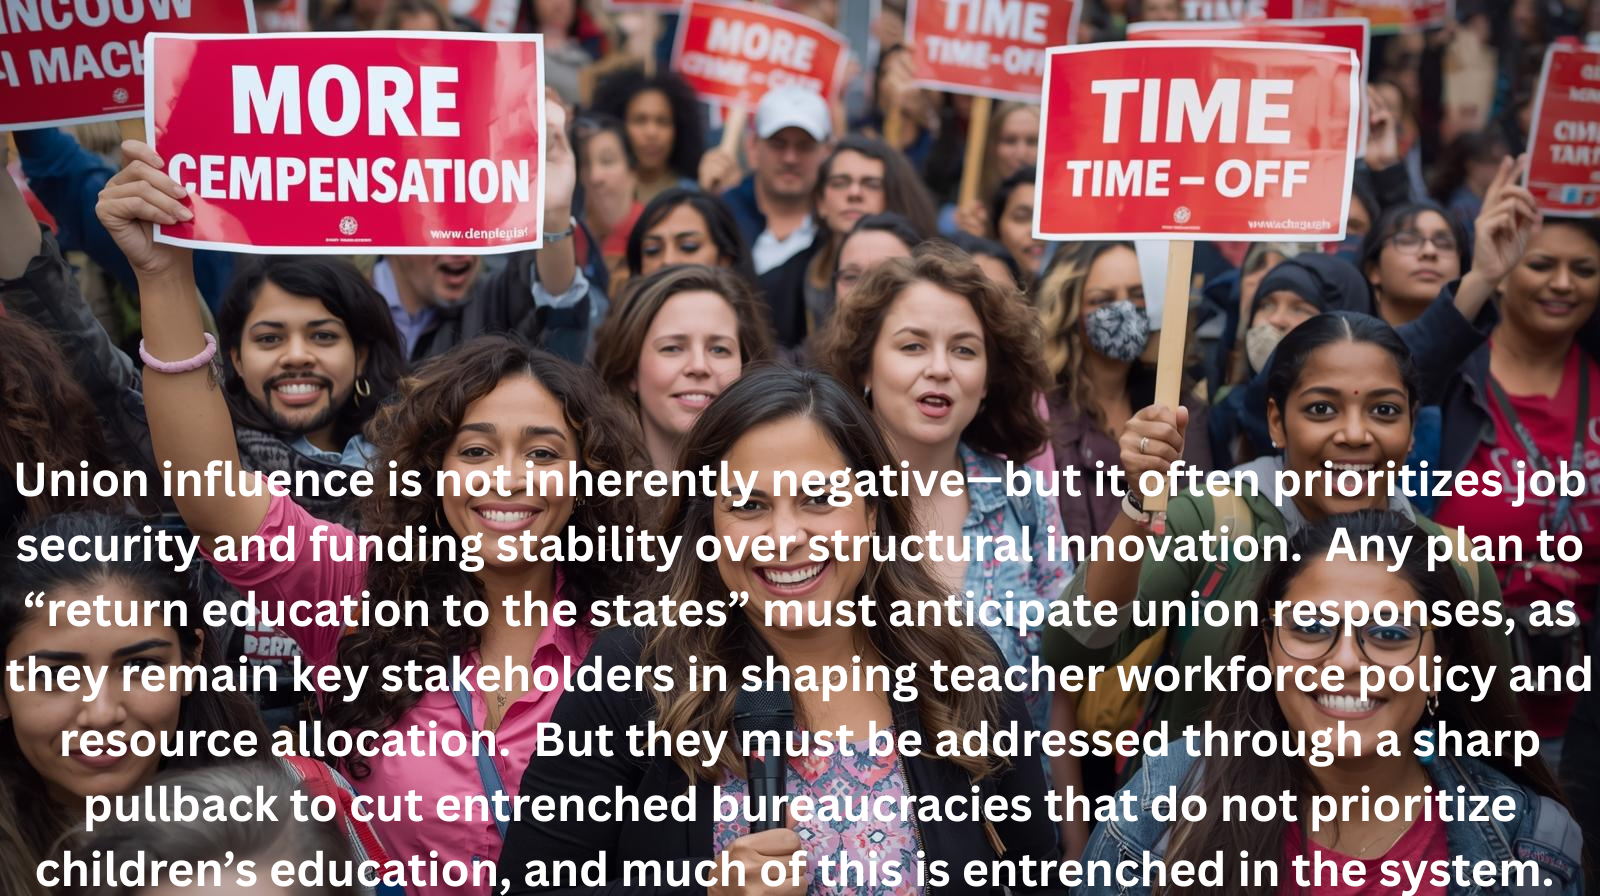
Union influence is not inherently negative—but it often prioritizes job security and funding stability over structural innovation. Any plan to “return education to the states” must anticipate union responses, as they remain key stakeholders in shaping teacher workforce policy and resource allocation. But they must be addressed through a sharp pullback to cut entrenched bureaucracies that do not prioritize children’s education, and much of this is entrenched in the system.
Below is a concise, state-by-state view of union membership rates (the share of employed wage and salary workers who are union members), based on the latest BLS annual release (28 January 2025), which covers 2024 averages. For the complete list of all 50 states plus DC, see BLS Table 5.
Top 10 States by Union Membership Rate (2024)
|
Rank |
State |
Union Membership Rate |
|
1 |
Hawaii |
26.5% [bls.gov] |
|
2 |
New York |
20.6% [bls.gov] |
|
3 |
Alaska |
17.7% [bls.gov] |
|
4 |
Connecticut |
16.5% [bls.gov] |
|
5 |
New Jersey |
16.2% [bls.gov] |
|
6 |
Oregon |
15.9% [bls.gov] |
|
7 |
Massachusetts |
14.6% [bls.gov] |
|
8 |
California |
14.5% [bls.gov] |
|
9 |
Rhode Island |
14.5% [bls.gov] |
|
10 |
Minnesota |
14.2% [bls.gov] |
BLS also reports that Hawaii and New York had the highest national rates in 2024. [bls.gov]
Bottom 10 States by Union Membership Rate (2024)
|
Rank |
State |
Union Membership Rate |
|
50 |
North Carolina |
2.4% [bls.gov] |
|
49 |
South Dakota |
2.7% [bls.gov] |
|
48 |
South Carolina |
2.8% [bls.gov] |
|
47 |
Georgia |
3.8% [bls.gov] |
|
46 |
Louisiana |
3.9% [bls.gov] |
|
45 |
Arkansas |
3.5% [bls.gov] |
|
44 |
Arizona |
3.7% [bls.gov] |
|
43 |
Tennessee |
4.7% [bls.gov] |
|
42 |
Florida |
5.1% [bls.gov] |
|
41 |
Idaho |
5.0% [bls.gov] |
BLS highlights also identify North Carolina, South Dakota, and South Carolina as the lowest rates nationally in 2024.
North Carolina’s exceptionally low union membership rate (2.4% in 2024) is the result of several structural and legal factors:
1. Right-to-Work Law
North Carolina is a right-to-work state, meaning employees cannot be compelled to join or pay dues to a union as a condition of employment. This significantly reduces union density compared to states without such laws.
2. Public-Sector Restrictions
State Law prohibits collective bargaining for public employees, including teachers and other government workers. While educators can join professional associations (such as the NCAE), these groups lack formal bargaining power, thereby limiting union influence in the largest nationally unionized sector (public education).
3. Historical and Cultural Context
The South has traditionally had lower unionization rates due to:
- A legacy of anti-union sentiment is tied to agricultural and low-cost manufacturing economies.
- Political environments favoring business-friendly policies and minimal labor regulation.
4. Economic Structure
North Carolina’s economy is dominated by non-union sectors such as finance, technology, and services, with relatively few heavily unionized industries, including auto manufacturing and mining.
5. Employer and Legislative Resistance
State policymakers and business groups have consistently opposed union expansion, reinforcing a climate where union organizing faces legal and cultural hurdles.
Bottom Line:
North Carolina’s low unionization rate is not an anomaly—it reflects a combination of legal prohibitions, economic composition, and regional political culture that collectively make union membership rare.
Right-to-Work (RTW) laws significantly affect unions by changing the economics and leverage of collective bargaining.
Here’s how:
1. Membership and Dues
RTW laws prohibit requiring employees to join a union or pay union dues as a condition of employment—even if the union negotiates the contract. This creates a “free rider” problem: workers benefit from union representation without contributing financially, which reduces union revenue and membership density.
2. Bargaining Power
Lower membership weakens unions’ ability to:
- Fund organizing campaigns and legal advocacy.
- Maintain strike funds and other leverage tools.
- Influence employer negotiations, since a smaller proportion of the workforce is actively engaged.
3. Political Influence
Unions rely heavily on dues for political lobbying and campaign contributions. RTW states often experience reduced union political spending, thereby shifting the policy environment toward business-friendly legislation and away from labor protections.
4. Geographic Patterns
RTW laws are concentrated in the South, Midwest, and parts of the West—regions that consistently report lower union membership rates (e.g., North Carolina: 2.4%; South Carolina: 2.8%). In contrast, non-RTW states such as New York (20.6%) and Hawaii (26.5%) maintain a strong union presence.
5. Education Sector Impact
Teacher unions (NEA, AFT) are particularly affected:
- In RTW states, unions cannot require dues, limiting resources for bargaining and advocacy.
- Public-sector bargaining may also be restricted or banned (as in North Carolina), further reducing union influence on education policy.
Bottom Line:
RTW laws don’t ban unions—they weaken their financial base and bargaining strength, leading to lower membership rates, diminished political clout, and less leverage in shaping workplace and education policy.